In this article we refer to some more data graphs found in the recent insurance-linked securities and catastrophe bond market report published by Willis Capital Markets & Advisory (WCMA). We first covered the report in this article here and then followed up with a piece posted earlier on the markets issuance volume and capacity. Now we wanted to highlight two interesting graphs which show the risk premium and expected loss of the catastrophe bond market over the last few years.
We’ve written about these two features of the catastrophe bond market before. The risk premium refers to the coupon or interest payment made to investors in return for taking on the risk in a transaction. The expected loss refers to a measure which denotes the probability of a loss occurring on a cat bond deal and so denotes how risky a transaction is perceived to be. By looking at how the average risk premium in the market and the average expected loss of cat bonds changes over time we can see how the market develops and what sort of coupon payments investors are demanding for a certain level of risk.
In the report from Willis Capital Markets & Advisory they have broken the market into two parts, U.S. wind exposed and non-U.S. wind exposed. This is useful as the U.S. wind cat bonds tend to pay particularly high coupons as the exposure and probability of attachment can be much higher. There is also some pressure on the coupon or risk premium payments thanks to traditional reinsurance rates which helps U.S. hurricane risks to be some of the more expensive to issue in a cat bond.
The first chart below shows the U.S. wind exposed weighted average risk premium and expected loss by quarter. As you can see there has been a lot of movement in these two trend lines in the last three and a half years. There has been a steady rise in the average expected loss up until the last quarter of 2011 but now that has flattened off at an average of 2.4%. Perhaps the cat bond market has found a sweet spot where deals with an expected loss of around 2.4% achieve more investor interest and can be easier to get to market. That’s an interesting thought as it could help potential sponsors identify the return-periods of hurricane risk that might be better suited to the cat bond market over traditional reinsurance. The risk premium has risen steadily over the last year and the average is now back near the highs seen in 2009, in the wake of hurricanes Katrina and Ike. This is interesting considering we haven’t seen a landfalling hurricane for a number of seasons now, and perhaps is more indicative of investors in the sector maturing and realising that they want a certain level of payment in return for this peak risk as well as traditional reinsurance pricing influences.
WCMA said that the trailing twelve month primary market spreads for U.S. hurricane exposed cat bonds widened further in the second quarter of this year, although Q2 data is somewhat distorted by the very large Everglades Re Ltd. transaction. The weighted average risk premium for hurricane risk has increased to 12.0% from 8.2% at the same time last year, while the weighted average expected loss for U.S. wind exposed cat bonds has moved to 2.4% from 2.3% over the same period.

U.S. Wind Exposed Catastrophe Bond Weighted Average Risk Premium and Expected Loss
The second chart shows the non-U.S. wind exposed weighted average risk premium and expected loss by quarter. As you can see, the average expected loss and risk premium follow a very similar trend in these diversifying risks, with divergence between the two less common. In general this shows that investors take on non-U.S. wind risk for lower premiums, but that these deals also have a lower average expected loss.
WCMA note that the market for cat bonds not exposed to U.S. wind has been more stable. The weighted average risk premium for non-U.S. wind risk has moved to 5.6% from 4.5% at the same time last year, while the weighted average expected loss for those cat bonds has moved to 1.8% from 1.5% over the same period.
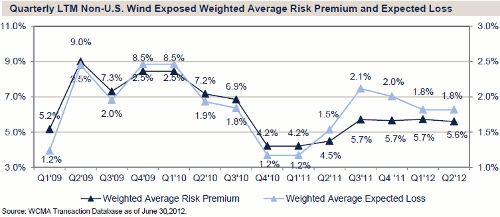
Non-U.S. Wind Exposed Catastrophe Bond Weighted Average Risk Premium and Expected Loss
Willis note that there is some evidence to suggest that the elevated cat bond spread levels seen in the primary market in the first half of 2012 may be starting to tighten somewhat. The secondary market has experienced some spread tightening during Q2 2012 and the last cat bond to come to market during the quarter, Long Point Re III Ltd., actually closed below its initial pricing guidance range on strong volume.
You can access the full report from Willis Capital Markets & Advisory here.
 View all of our Artemis Live video interviews and subscribe to our podcast.
All of our Artemis Live insurance-linked securities (ILS), catastrophe bonds and reinsurance video content and video interviews can be accessed online.
Our Artemis Live podcast can be subscribed to using the typical podcast services providers, including Apple, Google, Spotify and more.


