Swiss Re Insurance-Linked Fund Management

Mt. Logan Capital Management, Ltd.

Catastrophe bond & ILS market charts, statistics and data

These charts provide statistics and data visualisations on the catastrophe bond and insurance-linked securities (ILS) market, helping you to analyse cat bond and insurance-linked security (ILS) issuance and risk capital outstanding, as well as view data displaying cat bond and ILS market development.

We also have charts detailing issuance in the mortgage insurance-linked securities (ILS) market.

All of the underlying data sitting behind these charts and visualisations is taken from the Artemis Catastrophe Bond & Insurance-Linked Securities (ILS) Deal Directory.

Share

Our catastrophe bond and insurance-linked securities (ILS) charts:

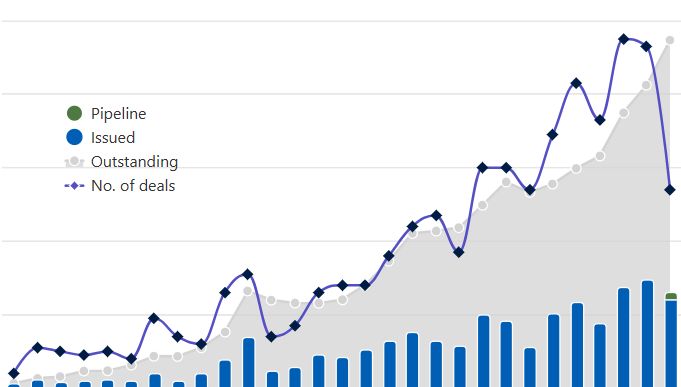
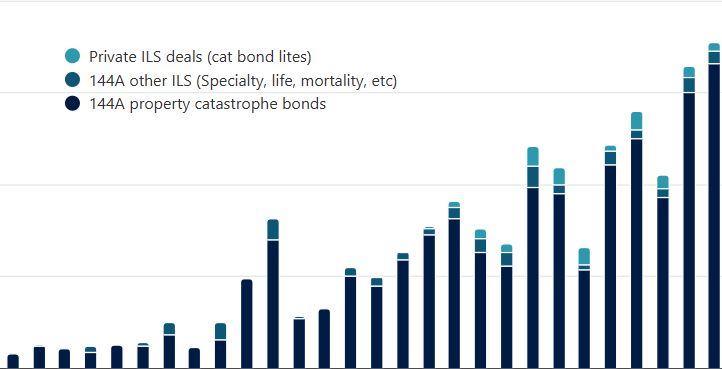
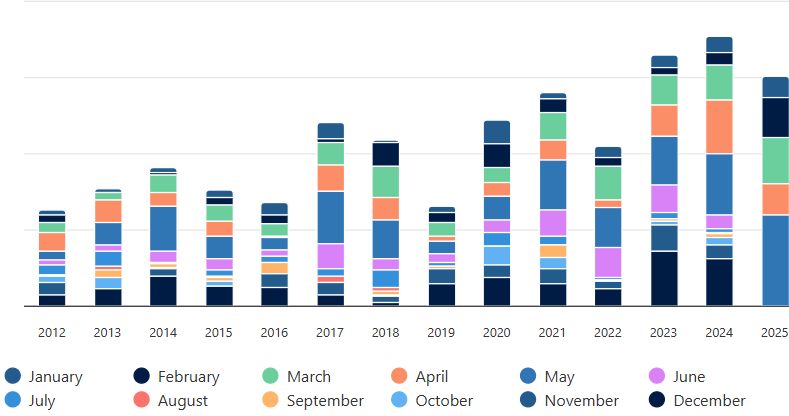
The data to create these charts is taken from the insurance-linked securities (ILS) issuance we’ve tracked in our Artemis Deal Directory. The majority of these charts are based on data from: pure 144a catastrophe bond deals; other cat bond like deals featuring specialty, life, mortality risk, etc; private cat bond lites or private ILS deals.

We’ve split our interactive cat bond market charts into the categories below:

Charts specific to mortgage insurance-linked securities (ILS) can be found here.

Artemis Live - ILS and reinsurance video interviews and podcastView all of our Artemis Live video interviews and subscribe to our podcast.

All of our Artemis Live insurance-linked securities (ILS), catastrophe bonds and reinsurance video content and video interviews can be accessed online.

Our Artemis Live podcast can be subscribed to using the typical podcast services providers, including Apple, Google, Spotify and more.


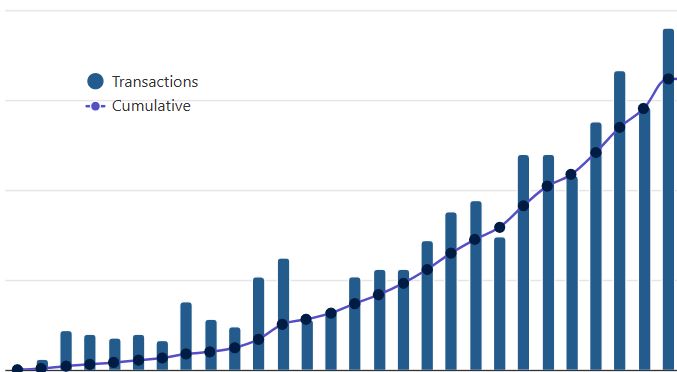
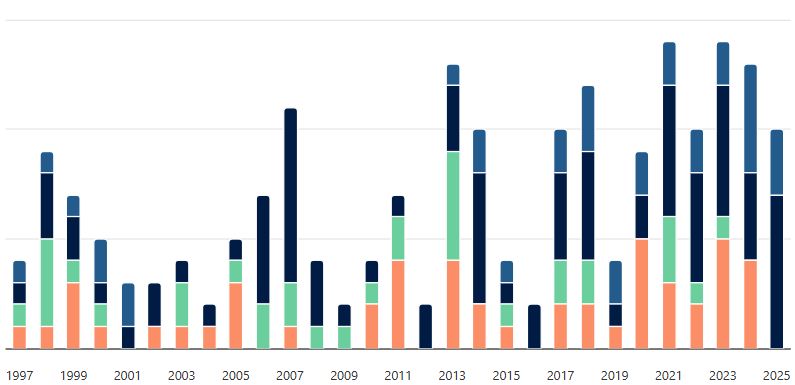
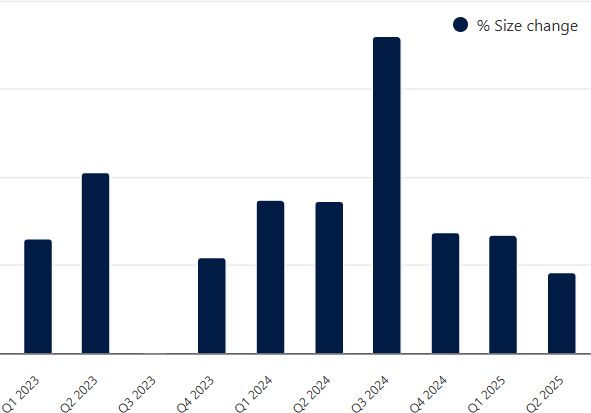
Catastrophe bond issuance charts and visualisations

Catastrophe bond & ILS market statistics
Catastrophe bond & ILS risk capital issued and outstanding by year

This chart allows you to analyse risk capital issued by year in the market for catastrophe bonds and related insurance-linked securities (ILS), as well as the amount of cat bond and ILS risk capital outstanding and how that has changed over time, so visualising cat bond and ILS market growth.

view chart

Catastrophe bond & ILS market statistics
Catastrophe bonds & ILS issued by type and year

This chart allows you to analyse catastrophe bond and related ILS risk capital issued by year, with the ability to segment the data by type of transaction. With this chart you can visualise cat bond and ILS issuance broken out into: pure catastrophe bonds; private cat bond deals; other types of cat bonds (specialty, life/health, mortality etc); or mortgage insurance-linked securities.

view chart

Catastrophe bond & ILS market statistics
Catastrophe bonds & ILS issued by month and year

This chart allows you to analyse catastrophe bond and related ILS risk capital issued by month and year, with the ability for you to filter by month and so analyse issuance trends by quarter or month, all across the last decade of issuance data that we have.

view chart

Catastrophe bond & ILS market statistics
* NEW * Upcoming catastrophe bond maturities, by quarter and month

These chart allow you to analyse the schedule of upcoming catastrophe bond maturities and the amount of insurance-linked securities (ILS) risk capital expected to roll-off risk by quarter and by month. Periods of high maturities can result in significant new liquidity in the market that needs to be deployed, so can affect cat bond market conditions and pricing.

view chart

Catastrophe bond & ILS market statistics
Cumulative catastrophe bond and related ILS market issuance by year

This chart displays the cumulative issuance of the cat bond and ILS market, showing the markets rapid growth including total issuance since the market began and the number of transactions issued each year.

view chart


Catastrophe bond sponsor leaderboard and first-time cat bond sponsors

Catastrophe bond & ILS market statistics
Cat bond & ILS risk capital outstanding by sponsor

This chart allows you to analyse catastrophe bond and related insurance-linked security (ILS) risk capital outstanding by sponsor. The chart displays who has the most cat bond or ILS risk capital outstanding, how many transactions they have acted as sponsor or cedant on, and how many tranches of notes were issued in these deals.

view chart

Catastrophe bond & ILS market statistics
* NEW * First-time catastrophe bond sponsors by quarter and year

This chart displays a visualisation of the number of first-time catastrophe bond and insurance-linked securities (ILS) sponsors by quarter and year. With this chart you can view and analyse the number of new sponsors that entered the market each quarter and year, and you can filter to only view quarters, or half-years.

view chart


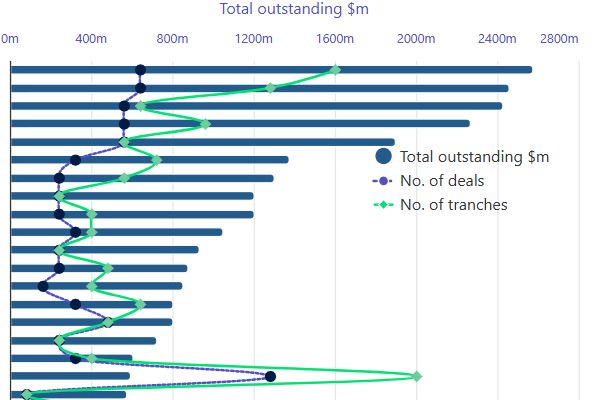
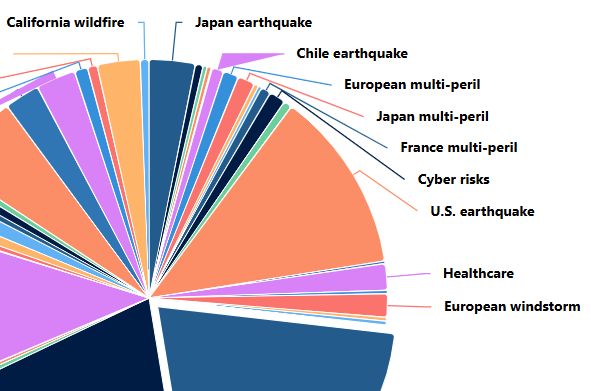
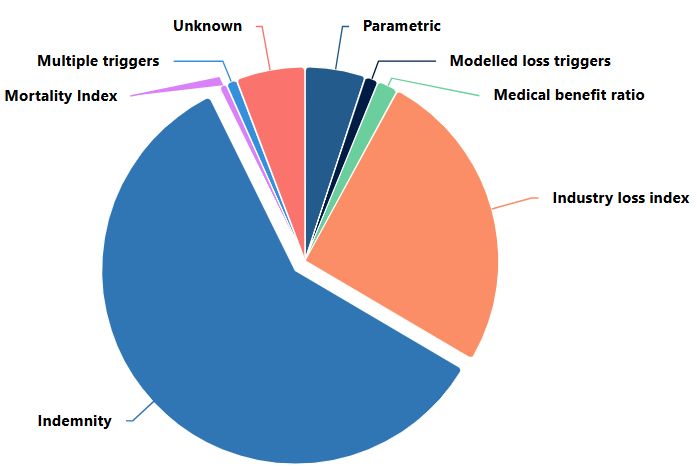
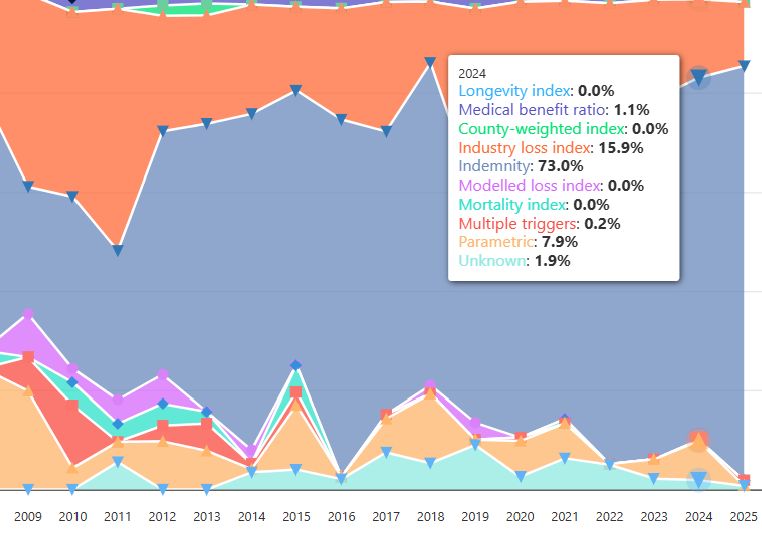
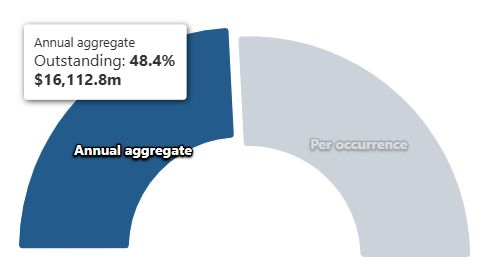
Charts and visualisations breaking down the catastrophe bond market

Catastrophe bond & ILS market statistics
Cat bond & ILS risk capital outstanding by peril class or risk

This chart displays the outstanding risk capital in the catastrophe bond and related ILS market broken down by risk or peril class. It allows you to view the amount of risk capital in the market by peril and the percentage of the outstanding cat bond and ILS market that each peril class contributes currently.

view chart

Catastrophe bond & ILS market statistics
Cat bond & ILS risk capital outstanding by trigger type

This chart displays catastrophe bond and related ILS risk capital outstanding by type of trigger. It allows you to view the amount of risk capital currently outstanding by each type of trigger used, as well as the percentage of the outstanding market attributed to each trigger currently.

view chart

Catastrophe bond & ILS market statistics
Cat bond & ILS issuance by trigger type and year

This chart shows the range of triggers used in catastrophe bond and insurance-linked securities (ILS) issuance by year, allowing you to see the trend in adoption rates of different cat bond trigger types.

view chart

Catastrophe bond & ILS market statistics
Cat bond & ILS risk capital outstanding by expected loss

This chart shows the expected loss of the outstanding catastrophe bond and related ILS market. It allows you to view the amount of risk capital currently outstanding by expected loss bracket, giving a good overview of the level of risk outstanding in the market.

view chart

Catastrophe bond & ILS market statistics
Cat bond & ILS risk capital outstanding by spread pricing

This chart shows the risk capital of the outstanding cat bond and ILS market segmented by spread pricing. It allows you to view the amount of risk capital currently outstanding by spread level, providing a good overview of the level of return outstanding in the market.

view chart

Catastrophe bond & ILS market statistics
Cat bond & ILS risk capital outstanding by coverage type – aggregate or per-occurrence

This chart shows the how much of the outstanding ILS and cat bond market provides coverage on an annual aggregate basis or on a per-occurrence basis. It allows you to view the amount of risk capital and percentage currently outstanding by type of coverage.

view chart


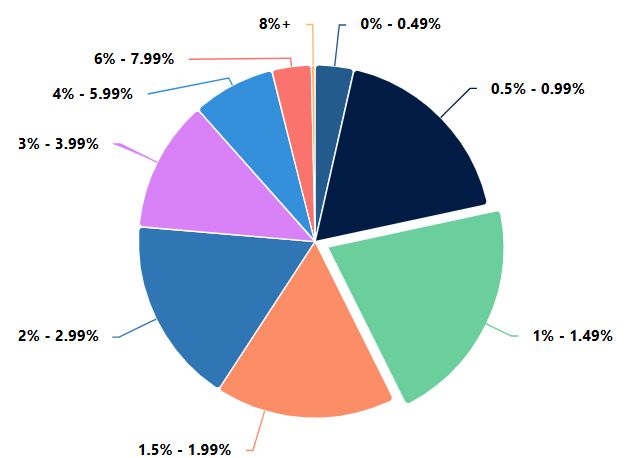
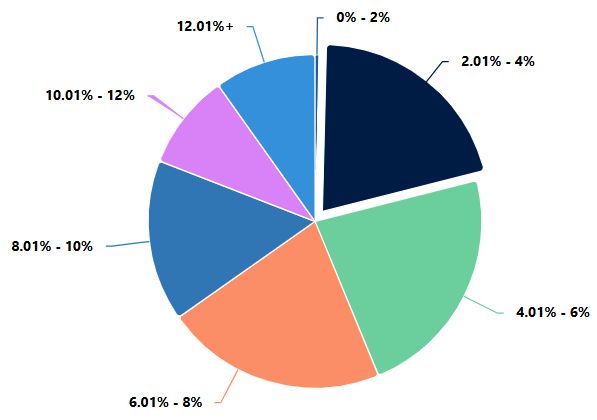
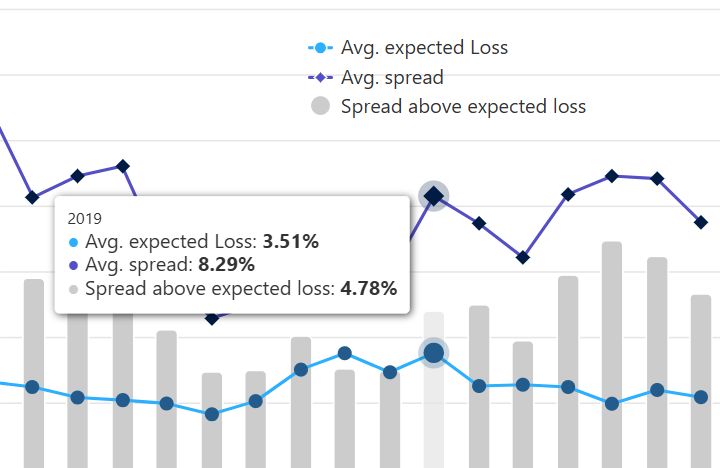
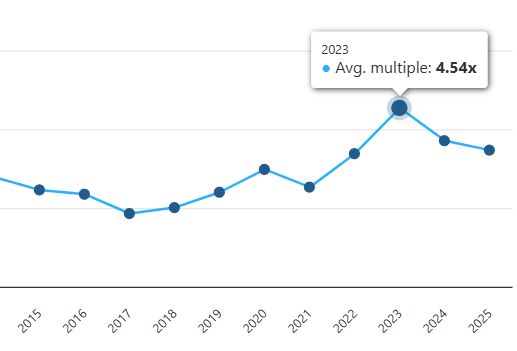
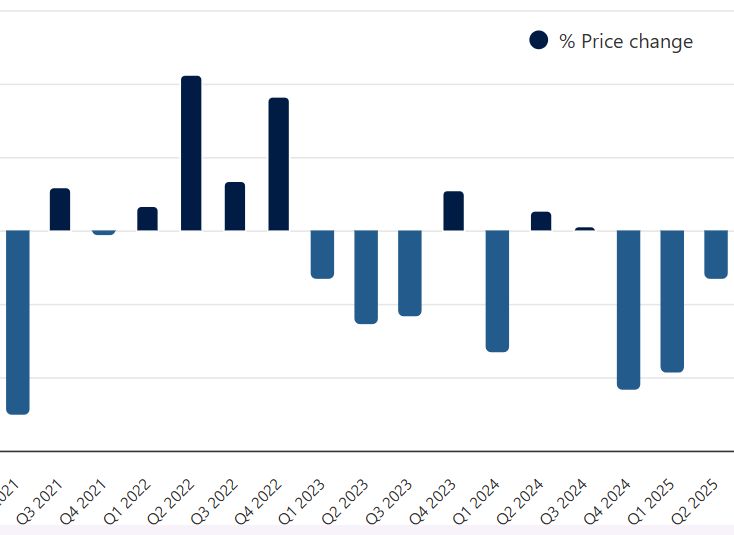
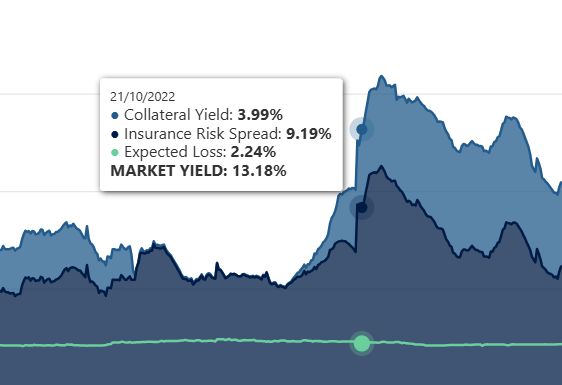
Catastrophe bond pricing at issuance charts and visualisations

Catastrophe bond & ILS market statistics
Average expected loss and spreads of cat bond & related ILS issuance by year

This chart shows the dollar value of issuance of catastrophe bonds and related insurance-linked securities (ILS) broken down by the average expected loss, average spread and also the delta between them, by year. This page also shows the data broken out by quarter of issuance, for a more granular view of catastrophe bond pricing trends.

view chart

Catastrophe bond & ILS market statistics
Average multiple (expected loss to spread) of cat bond & related ILS issuance by year

This chart shows the average multiple of catastrophe bond and insurance-linked securities (ILS) transactions issued, represented as the expected loss to spread pricing for each year. This page also shows the data broken out by quarter of issuance, for a more granular view of catastrophe bond pricing trends.

view chart

Catastrophe bond & ILS market statistics
* NEW * Catastrophe bond price changes from mid-point of initial guidance

This chart displays a visualisation of how much in percentage terms catastrophe bond prices at issuance had on average moved from their initial mid-point of guidance, by quarter. It helps you analyse how market pricing has been moving over time, showing periods of particularly strong demand from investors, as well as price softening or hardening.

view chart

Catastrophe bond & ILS market statistics
* NEW * Catastrophe bond offering size changes during issuance

This chart displays a visualisation of how much on average in percentage terms catastrophe bond offering sizes changed during the issuance process. Again, this helps to show changes in demand from investors, as well as market conditions and periods of strong execution.

view chart

Catastrophe bond & ILS market statistics
Catastrophe bond market yield over time

This chart allows you to analyse the yield of the catastrophe bond market over time, as well as its constituents. We break out the insurance risk spread, the collateral return and also plot the expected loss on the chart, so you can see how cat bond yields have developed over time.

view chart


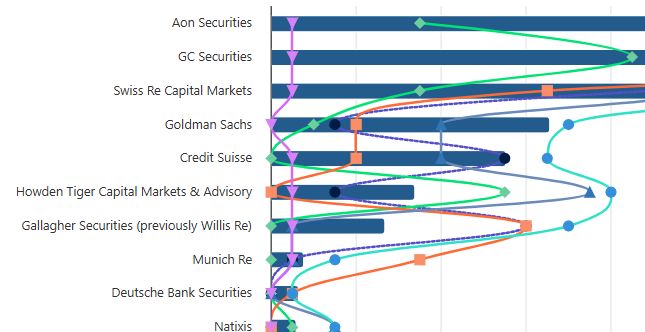
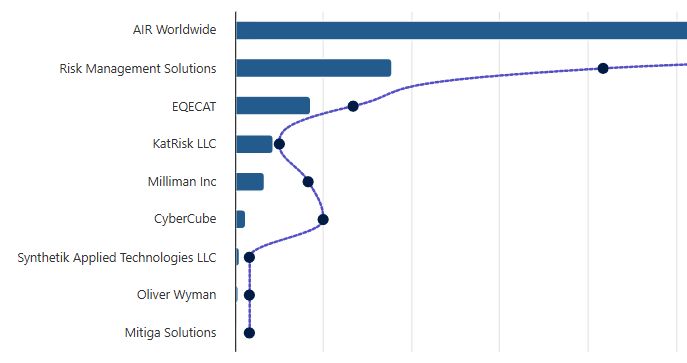
Catastrophe bond market service provider leaderboards
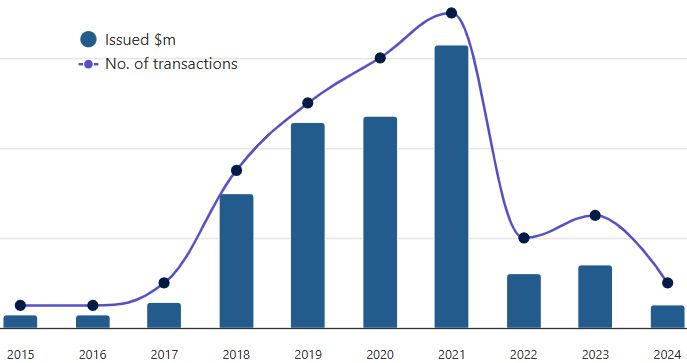
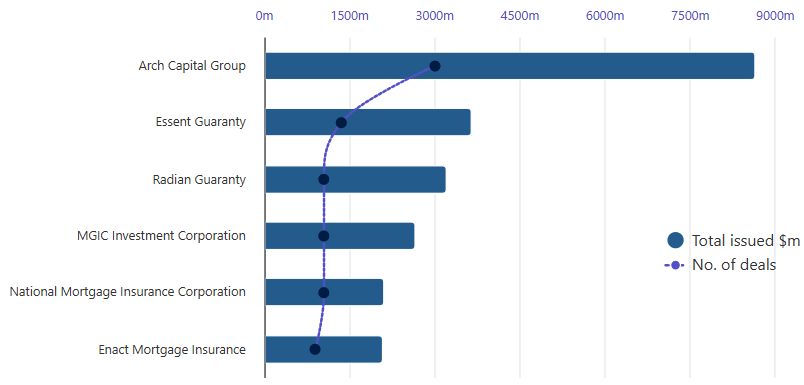
Catastrophe bond & ILS market statistics
Catastrophe bond & related ILS issuance bank & broker leaderboard

This chart and leaderboard shows the activity of investment banks and broker units acting as structurers, bookrunners or managers for the outstanding cat bonds and ILS included in our Deal Directory.

view chart

Catastrophe bond & ILS market statistics
Catastrophe bond & related ILS issuance risk modeller leaderboard

This chart shows which third-party risk modelling firms are most prolific at this time in the outstanding catastrophe bond and insurance-linked securities (ILS) market, based on the data we have collected.

view chart


Mortgage insurance-linked securities (ILS) charts

Catastrophe bond & ILS market statistics
Mortgage insurance linked securities issuance by year

This chart shows mortgage insurance-linked securities (ILS) issuance in dollar value and the number of deals issued by year, based on the data we have collected.

view chart

Catastrophe bond & ILS market statistics
Mortgage insurance linked securities sponsor leaderboard

This chart shows which mortgage insurers are the most prolific sponsors of mortgage insurance-linked security (ILS) transactions, based on the data we have collected.

view chart

Every effort has been made to accurately reflect the amount of cat bond and ILS issuance each year, overall size of the cat bond and ILS market, the mix of transactions and transaction specific features of the catastrophe bond, insurance-linked securities and mortgage insurance-linked notes markets.

Aeolus Capital Management Ltd.

RenaissanceRe Capital Partners

LGT Insurance-Linked Strategies

Leadenhall Capital Partners LLP

ILS Advisers
AXA XL ILS Capital Management

Vantage Risk

SS&C GlobeOp

Truist - Trust and escrow services for reinsurance and ILS

Bermuda Stock Exchange

PCS - Emerging Risks, New Opportunities

GC Securities

Schroders Capital - Insurance-linked securities ILS

Advertise Here
Nephila Capital

Wilmington Trust

plenum234x60-home

Advertise Here

Computershare Corporate Trust

Hiscox ILS (home)

SCOR Investment Partners
To advertise here please contact us

Euler ILS Partners

Twelve Securis