Catastrophe activity during the second-quarter of the year has resulted in the lowest first-half catastrophe insured loss total across the U.S. and Canada since 2010, but the frequency of events is on the rise, according to Property Claims Services (PCS).
PCS’ recently published Q2 2015 Catastrophe Review, ‘Barely a Whisper,’ notes that 17 catastrophe events in the U.S. and Canada during the second-quarter resulted in insurance and reinsurance industry losses of $5.3 billion, taking the H1 total to $8.1 billion.
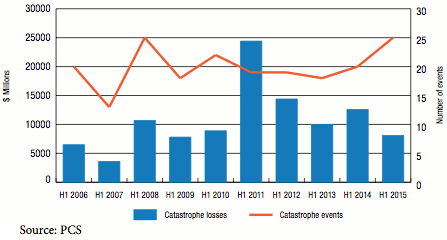
“If the industry thought last year was quiet, it’s pretty safe to say 2015 has been little more than a whisper so far,” notes PCS, explaining that this is the lightest H1 for catastrophe-related insured losses in the U.S. and Canada for the last five years, highlighted by the graph below.

H1 PCS-Designated Catastrophe Events and Insured Losses
The above image, provided by PCS, also shows that while H1 2015 insured losses dropped by 36% from the same period in 2014, below the ten-year average of $10.4 billion, the frequency of events has been on the rise in recent years, reaching 26 PCS designated events at the latest tally (25 U.S. and 1 Canada).
The report states that the H1 ten-year average for catastrophe frequency across the U.S. and Canada is 19.9 events, so 2015 has been well above this in terms of event occurrence.
PCS notes that this represents a continued “trend toward increasing numbers of smaller events.” Highlighting that should these increasingly frequent but smaller events grow in severity, or impact areas that experience a higher concentration of insurance penetration, the losses to the insurance and reinsurance industry could soon rise also.
“We’ve been closely watching the trend toward smaller, more frequent catastrophes,” commented Joe Louwagie, assistant vice president, PCS. “For claims departments across North America, this may have implications for catastrophe response planning, and the claims community should remain vigilant: Hurricanes Katrina, Rita, and Wilma followed the quietest first half in the past ten years.”
With the rise of aggregate reinsurance contracts, becoming a preference for many insurers, it is perhaps relevant to highlight the increased frequency of smaller catastrophe loss events. These events can aggregate up to trigger reinsurance programs over the course of the year, so reinsurers and insurance-linked securities (ILS) markets need to be aware of this trend.
During the first-half of 2014 five separate events incurred insurance industry losses exceeding the $1 billion mark. In comparison, H1 2015 witnessed just one such billion dollar catastrophe event, notes PCS.
The only U.S. state to witness damages surpassing the $1 billion mark during the first six months of the year was Texas, the state most affected by catastrophes and experienced insurance industry losses of above the $2 billion mark.
Following this was Massachusetts at $900 million, of which the majority of the insured loss total was incurred following the intense winter storm events during Q1, covered at the time by Artemis.
Below is a list of the top ten catastrophe impacted states during the first-half of 2015.

Top Ten Catastrophe-Affected States in H1 2015
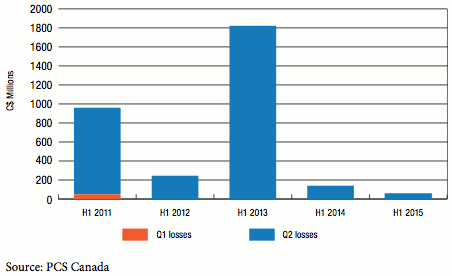
For Canada, PCS also reported the lowest H1 catastrophe insured loss total for the last five years, at just $43.3 million (C$56 million) from a single wind and thunderstorm event that impacted Alberta and Saskatchewan.
The chart below shows that typically, any H1 insurance industry losses from catastrophes in Canada take place during the second-quarter, the last time losses occurred in Q1 was back in 2011, according to the data provided by PCS.

PCS Canada Insured Losses 2011–2015
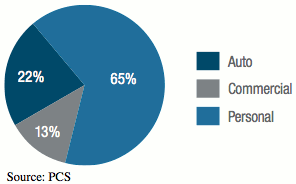
Broken down by line of business category, PCS reveals that as in H1 2014 personal losses accounted for the bulk of Q2 losses, at $1.5 billion or 65%. However, Q2 2015 saw auto losses follow with 22% of activity compared with just 2% during the same period in 2014. Commercial losses accounted for 13% of activity in the second-quarter of this year, compared with 23% in Q2 2014.
 View all of our Artemis Live video interviews and subscribe to our podcast.
All of our Artemis Live insurance-linked securities (ILS), catastrophe bonds and reinsurance video content and video interviews can be accessed online.
Our Artemis Live podcast can be subscribed to using the typical podcast services providers, including Apple, Google, Spotify and more.

Q2 2015 Losses from PCS-Designated Events by Category


