Reinsurance broker Aon Benfield’s catastrophe model development arm Impact Forecasting released its latest annual study of catastrophe events and the resulting economic and insured losses yesterday. The Annual Global Climate and Catastrophe Report looks back at the disasters of 2012 and provides statistics and analysis on the year versus prior loss years. Hurricane Sandy, unsurprisingly, was the largest insured loss event of the year with an estimated cost to the market of $28.2 billion.
Aon Benfield’s estimate of insured losses from hurricane Sandy of $28.2 billion includes both losses to private insurers as well as the government backed National Flood Insurance Program (NFIP). No breakdown is provided, but taking the mid-range of the NFIP’s estimate would be $8 billion leaving $20 billion to the private insurance market. We’re not sure whether Aon Benfield’s estimate includes directly reinsured business, such as the $1 billion plus losses the Mass Transit Authority faced.
The estimate is in line with many others, and not far above the latest estimate from reporting agency PCS who upped its estimate to $18.75 billion earlier this week. Some estimates still suggest the total loss to the insurance and reinsurance market will be nearer to $25 billion, but we will have to wait to see how much the estimates issued by major insurers creep up when they are finalised.
With Sandy being the largest insured loss of the year, the U.S. is a particular focus of the report from Aon Benfield. According to the data 2012 saw 295 natural peril events worldwide, up on the 257 from 2011, causing economic losses of $200 billion. This puts 2012 slightly above the 10-year average figure of $187 billion.
Two events, hurricane Sandy and the U.S. drought, accounted for two-thirds (67%) of all the catastrophe insured losses for the year and almost half of the economic losses. The drought is estimated to have caused $20 billion of insured losses over the course of the year. Aon Benfield are in agreement with Munich Re’s catastrophe data and they both put the U.S.’s contribution to insured catastrophe losses in 2012 as 90% of the global total, making it a very U.S. focused year for insurance losses.
Stephen Mildenhall, Chief Executive Officer of Aon Benfield Analytics, commented; “Despite growing support for “the new normal” theory of a world dominated by rapidly escalating global catastrophe losses, our study highlights that 2012 returned to a more normal level of losses after the extreme economic and insured losses of 2011. While nominal catastrophe losses are increasing at an alarming rate, economic losses as a percent of global GDP – a measure appropriately normalized for inflation and economic development – has remained relatively stable over the past 30 years. The moderate level of catastrophe losses for 2012 is reflected in strong growth in reinsurer capital during the year.”
Steve Bowen, Senior Scientist and Meteorologist at Impact Forecasting, added; “After a year in which Asia and Oceania sustained significant natural disaster losses, the focus shifted back to the United States in 2012. The country was hit by nine separate billion-dollar insured loss events, including Hurricane Sandy and the most extensive drought since the 1930s. Tornado activity was dramatically lower than 2011, which can partially be attributed to the drought. U.S. severe weather losses were close to the recent five year average and 46 percent less than the record losses seen in 2011. Finally, 2012 marked the seventh consecutive year that no major hurricane made landfall in the U.S.; a streak not seen since the 1860s.”
Aon Benfield put total insured losses for the 2012 catastrophe loss year at $72 billion, this is 36% above the ten-year average of $53 billion. In terms of fatalities 2012 saw around 8,800 deaths due to natural disasters, which is well below the ten-year average of 103,000. That shows that costs go up when disasters are in the U.S. but deaths go down dramatically, compared to a year when disasters are focused on developing regions such as Asia where insurance penetration and disaster risk management are not as prevalent.
Aon Benfield also released a useful website containing catastrophe data and the ability to generate charts and view the top ten catastrophe losses for any particular year. Some highlights from the catastrophe data for 2012 can be found below. and you can access the new Catastrophe Insight website here.
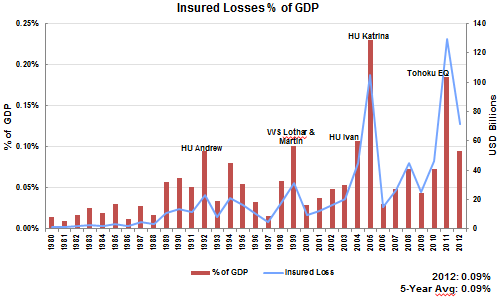
Aon Benfield provide some telling data on economic losses and insured losses versus GDP. Over the last 32 years as a percentage of global GDP, economic losses have only grown by 1.9%, to a recent average of around 0.4% per annum. However, and perhaps demonstrating the growth of the insurance market, insured losses have grown as a percentage of global GDP by 5.3% to an average around 0.9%. The chart below shows insured losses as a percentage of GDP and it’s easy to see why that ratio has grown given the steepening curve of insured losses.

Global Insured Losses as a Percentage of Global GDP 1980-2012
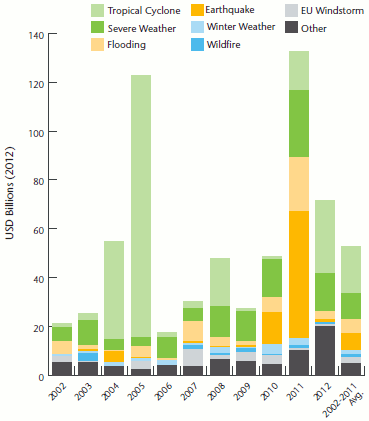
The next chart shows the breakdown of insured losses by peril for the last ten loss years. 2012 was fairly mixed compared to some years where one peril dominates. Sandy made 2012 top-heavy on tropical cyclone losses, but only slightly. For reinsurers the stack for 2005 should serve as a warning about what can happen if the Atlantic hurricane season throws many landfalling storms towards the U.S. For the catastrophe bond and ILS investment market 2005 should serve as a warning to ensure you’re well diversified.

Global insured losses by peril
The report also contains many useful data points on catastrophe losses by peril and year. You can download the full report via Aon Benfield’s new website Catastrophe Insights.
 View all of our Artemis Live video interviews and subscribe to our podcast.
All of our Artemis Live insurance-linked securities (ILS), catastrophe bonds and reinsurance video content and video interviews can be accessed online.
Our Artemis Live podcast can be subscribed to using the typical podcast services providers, including Apple, Google, Spotify and more.


