

The impacts of recent hurricanes is evident in the latest returns of the Mercury investible Catastrophe Risk Index (or MiCRIX for short), an index that tracks the performance of a diversified portfolio of peak peril ILW’s.
 The MiCRIX, developed by Bermuda based industry loss warranty (ILW) focused investment manager Mercury Capital, creates broad, diversified exposure to the reinsurance sector through ILW investments and emulates the returns an investor could make if following an ILW only allocation strategy.
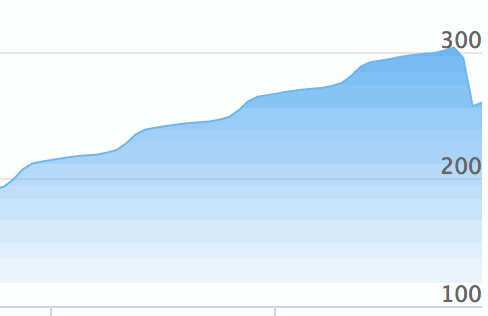
The index fell by 2.7% in August and then a further 12.9% in September before returning to positive performance in October with a 1.1% gain.
Charlie Griffiths, CEO of Mercury Capital, explains the cumulative drawdown of 15.6% across August and September, “The index performance has been hit by both hurricanes Harvey and Irma. In August, whilst Harvey was still developing as an event, we reflected losses to the lowest rung of the index’s Gulf attachments. Then in September the remainder of the Gulf exposure was written down following the release of PCS’ initial loss estimate. The Index has no further exposure to an increase in the Harvey loss estimate.
“For Irma, the first loss estimate was available before the end of September and this is reflected in the September performance. The index has further Florida exposure that could be impacted if the loss estimate for Irma increases in future loss reports.
“The index has no second event or aggregate exposure nor any Caribbean or Mexican exposure, greatly simplifying estimation of the loss impacts.
“Looking back, these events have drawn down about 24 month of accrued gains. However with price increases expected at 1/1 the index could easily get back to its previous high more quickly than that.”
The MiCRIX provides a useful way to look at how recent catastrophe losses have affected the ILW market. With its focus on peak exposures, the index will only reflect losses from hurricane Harvey and hurricane Irma. MiCRIX does not contain any Caribbean or Mexican exposure so neither Maria nor the recent earthquakes will impact it.
September is the 3rd worst month in MiCRIX’s history and it could well have been the worst single month if it wasn’t for the positive impact of seasonal premiums which also flow into ILW investment strategies during the peak month of the wind season.
It should be remembered that the MiCRIX represents a diversified basket of ILW’s with global peak perils equally weighted. It does not necessarily reflect the impact that recent events have had on the market as a whole. The Index demonstrates the importance of diversification within ILW investment strategies, something investors will be only too conscious of after third-quarter catastrophe events.
ILW losses from these two hurricanes will emanate from more than just from first-event covers – those that pay out when industry insured losses rise above a pre-determined level from a single catastrophe event.
These events are also likely to impact some second-event U.S. hurricane ILW’s and some US Aggregate Covers which will exacerbate the market impact. After all these two events look destined to combine to deliver at least $35 billions of insurance industry losses.
The aggregated impact of two major hurricanes in quick succession has caused a significant hit to second-event ILW’s, we understand.
Given ILW’s are typically a retro product, this reflects the retrocessional reinsurance market which saw a similar hit from Harvey’s impacts on Texas and Irma’s on Florida.
Track the performance of the Mercury investible Catastrophe Risk Index (MiCRIX) here on Artemis.
![]() View all of our Artemis Live video interviews and subscribe to our podcast.
View all of our Artemis Live video interviews and subscribe to our podcast.
All of our Artemis Live insurance-linked securities (ILS), catastrophe bonds and reinsurance video content and video interviews can be accessed online.
Our Artemis Live podcast can be subscribed to using the typical podcast services providers, including Apple, Google, Spotify and more.