


Inertia is a scary thing. We tend to get used to doing things in a certain way, because “that’s the way we’ve always done it”, even if we know the thing is clearly broken.
Following investigations of several hurricanes in the 1960s, Herb Saffir, a structural engineer from Coral Gables, FL., devised a rating system for the United Nations to classify hurricanes into five descriptive structural damage categories. Herb then collaborated with Bob Simpson, director of the National Hurricane Center, who added storm surge and central pressure ranges to what became the Saffir-Simpson Hurricane Scale (SSHS). It was difficult to measure hurricanes in those days. Navigation equipment onboard reconnaissance aircraft was crude, and anemometers – if they survived, were just too few and far between. Nonetheless, maximum winds were estimated and the Saffir-Simpson scale became an effective way to communicate storm intensity to the public.
The basis for the SSHS is an estimate of the maximum sustained wind speed, a quantity that is difficult to measure and that represents just a tiny portion of the hurricane or typhoon eyewall. The SSHS has also spawned additional metrics to describe the tropical cyclone climate by basin such as Accumulated Cyclone Energy (ACE) and the Power Dissipation Index (PDI), which simply square or triple the maximum wind speed and sum it up over the life of a storm.
For years, the Saffir-Simpson scale has served as the primary metric for storm destructiveness, helping to alert the public to major threats to life. The ubiquity of the scale and the lack of alternatives also meant it became a basic underwriting tool for the insurance industry. Hurricane loss models regulated by the Florida Commission on Hurricane Loss Projection Methodology are required to use the SSHS to categorize modeled storms and match historical landfall frequencies. Following the New Orleans levee system failures from Hurricane Katrina in 2005, politicians even talked about an ultimate goal of “Cat 5 protection”. Saffir¹ (1917-2007) and Simpson² (1912-2014) were both esteemed colleagues of mine who have since passed away. We will not forget their valuable contribution to hurricane science, improved building codes, and engineering. But this does not mean we cannot now improve upon what they started.
The weaknesses of using SSHS
The problem with the SSHS is that it fails miserably for low intensity, high-impact storms. For example, a large but relatively weak “sleeper” storm like Sandy (not even a hurricane at landfall), or Irene (SS Cat 2, 2011), and Ike (SS Cat 2, 2008) all resulted in losses way out of proportion to their SSHS values. Typically, most of these losses result from flood, but if 50+ mph winds affect widespread areas, then significant wind losses can accumulate. It can then become difficult for adjusters to attribute between wind and water damage. After the failure of the scale to represent the destruction from Hurricane Ike in 2008, the National Hurricane Center removed Simpson’s surge and pressure ranges and renamed it as the Saffir-Simpson Hurricane Wind Scale (SSHWS) in 2010. Unfortunately, this tweak has not fixed the problem.
SSHWS also fails to reflect how large, moderate intensity storms such as SS Cat 3 Katrina can cause more devastation than an extreme intensity SS Cat 5 hurricane such as Camille in 1969 when they strike in the same location. This tendency for most of the extreme storms to be small means that a worst nightmare storm in the Gulf of Mexico might not be a SS Cat 5 – but a large SS Cat 3. A tiny SS Cat 5 like Patricia last year (Fig. 1) can easily miss significant coastal population centers on Mexico’s Pacific coast but a huge Cat 3 following Patricia’s path could have damaged both Puerto Vallarta and Manzanillo.
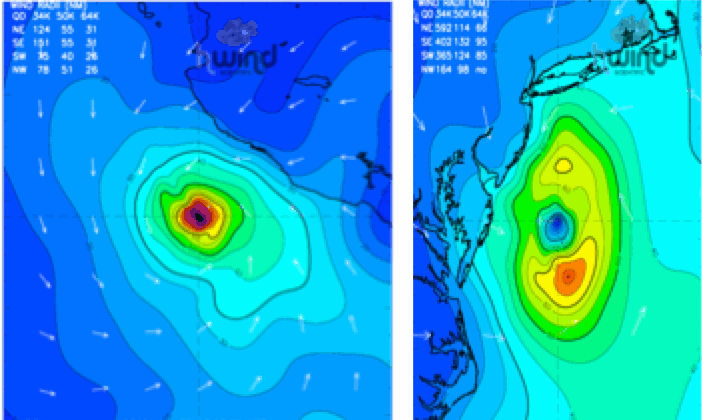
Fig 1: Wind field maps from HWind, showing:- Left: Patricia (max wind 170 knots) on 10-23-2015, and right: Sandy (max wind 77 knots) on 10-29-2012. The tropical storm wind contour (34 kts) of Patricia covers a much smaller region than Sandy and comprises an integrated kinetic energy of 30 terajoules compared to Sandy’s 190 terajoules.
The public safety concern is obvious – when a Cat 2 can be more dangerous than a Cat 5, it is hard to motivate people to take the necessary steps to protect themselves, as they are lulled into a false sense of security that the impending storm is not even a “major” hurricane.
For the insurance industry, the SSHWS creates issues for contract terms that require any quantification of storm severity – whether it is as simple as the event definition, or defining more precise covers tailored to specific risks, such as cat in a box contracts. A storm might intersect a box with a given SS category or central pressure, but as these parameters do not correlate strongly to loss, it can be very difficult to construct a trigger that doesn’t include significant basis risk.
Integrated Kinetic Energy (IKE) as an alternative scale
There’s no argument that a simple scale from one to five is easy to comprehend, but why not take into consideration the fundamental physics and spatial extent of damage to define that scale? If we consider the horizontal wind loading as described in US building practice (American Society of Civil Engineers/SEI 7-10), then that force depends on the square of the wind speed. Now also consider that the fundamental forcing for storm surge and waves is from the shearing stress of the wind on the ocean surface, which depends on the square of the wind.
Kinetic energy is a good proxy for this forcing, since it is the product of one-half the mass of the air and the square of the wind. If we consider that the density of air hovers a little over unity (about 1.15 kg/m3 in a significant hurricane) we need only add up the kinetic energy for the portions of the storm that have a reasonable chance of contributing to the damage. Since most damage models used to compute insurance loss do not start producing “damage” until peak three-second gusts reach 50 mph, this would correspond to a sustained wind speed of tropical storm force, defined as greater than 39 mph. Therefore, to get a good basic metric for destructive potential, we sum up the kinetic energy over the portion of the wind field exceeding 39 mph. Of course actual damage is not that simple. Wind damage is complicated further by factors such as turbulence and interactions with buildings and debris missiles. Wave and surge damage additionally depends on water depth, shelf slope, storm speed, and coastline shape, but Integrated Kinetic Energy (IKE) is a good basic metric for damage from a hurricane.
How do we calculate IKE? All we need is a wind field. A wind field can come from a model in advance of observations being available, or from an objective analysis of hurricane observations themselves. We have come a long way since the Seventies. Reconnaissance aircraft now use Doppler radar, GPS dropsondes and sophisticated sensors that measure winds from the microwave emission of foam on the ocean surface. Satellites detect cloud motions and scattering from small capillary waves to measure winds over large areas surrounding the storm. NOAA maintains a network of Doppler radars and automated surface stations. Some mesonets – public and private weather station networks, use hardened anemometers such as those operated by WeatherFlow and EarthNetworks. When evaluated in a modern observing system, we can develop independent objective estimates of the hurricane wind field (e.g. Fig. 1) that have high definition and scientific credibility backed up by published research.
Using this level of detail within a rapid update cycle, we can map the wind field effectively and compute the IKE every three hours. The wind maps and IKE calculations can provide real-time situational awareness and decision support for use in the insurance market, providing short-term projections of potential loss ranges, and to plan for loss adjuster support and claim centers. Post-storm we can compare the modeled footprint to a footprint based on observed winds or use the wind fields for a comprehensive storm surge and wave model hindcast evaluation. Post season, we can accumulate the IKE values for each storm as a climatic measure of the destructiveness of a particular hurricane basin over a season.
Advanced hurricane models have evolved to ensure a more holistic approach where we simulate both wind and flood damage together. Fundamentally, the wind field that drives the storm surge model should be the same wind field that drives the wind damage vulnerability curves. Similarly, measurements of storm severity should be consistent across all means of damage. IKE-based metrics allow examination of deep tail risk that can be completely missed using SSHWS.
By combining the basic physics that contribute to both wind and storm surge forcing, Integrated Kinetic Energy becomes a powerful basic underwriting tool that will classify the Sandy’s of the future. With objective classification linked to real storm severity also comes opportunity, for better event definitions, contract terms, and triggers.
[1] I served on Herb Saffir’s American Society of Civil Engineers committee on hurricane disaster reporting in the early 1990s and presented our new scale to him in his office in 2006.
[2] Bob Simpson founded the National Hurricane Research Laboratory, now the Hurricane Research Division where I served my NOAA career.
This article was written by Mark D. Powell, vice-president of model development for Risk Management Solutions Inc.
For further reading:
Powell, M. D. and T. A. Reinhold, 2007: Tropical cyclone destructive potential by integrated kinetic energy. Bull. Amer. Meteor. Soc., 87, 513-526.
Powell, M. D. and V. Misra, June 3, 2015: There are better ways to quantify how big and bad a hurricane is. The Conversation.
Simpson, R. H., The hurricane disaster potential scale. Weatherwise, 27, 169-186, (1974).
Saffir, H. Low Cost construction resistant to earthquakes and hurricanes. ST/ESA/23, United Nations, 149-162, (1975).
![]() View all of our Artemis Live video interviews and subscribe to our podcast.
View all of our Artemis Live video interviews and subscribe to our podcast.
All of our Artemis Live insurance-linked securities (ILS), catastrophe bonds and reinsurance video content and video interviews can be accessed online.
Our Artemis Live podcast can be subscribed to using the typical podcast services providers, including Apple, Google, Spotify and more.