


One of the metrics we like to take a look at occasionally is the average expected loss of the outstanding catastrophe bond market to see what it can tell us about the kind of transactions that have come to market and where the cat bond and ILS market feels its risk appetite sweet spot is. Expected loss metrics portray the probability of a loss of a certain size occurring on a specific transaction and so give a good idea of risk level and are used to help derive pricing.
So looking at how the expected loss characteristics of the outstanding cat bond market has changed over time can give us an insight into two things. Firstly, on the issuers or sponsors side it can show us the level of risk that cedents feel the cat bond market is receptive to, trends in expected loss give us an idea what level of risk sponsors want to transfer to the capital markets versus those they retain or pass on to the traditional reinsurance markets. Secondly, on the investor side the expected loss of cat bond deals give us an insight into investors risk appetites, particularly when you compare expected loss to deal pricing.
The latest report on the 2012 catastrophe bond and insurance-linked securities market from Willis Capital Markets & Advisory (WCMA), the capital markets and cat bond focused division of global insurance broker Willis, contains some good ways to look at the average expected loss and also to compare it to the average risk premium paid.
The first useful graphic from that report shows catastrophe bond risk capital outstanding broken down into different expected loss bands and compares the market at the end of 2012 with a year earlier. As you can see the market looks like it has shifted slightly towards a higher expected loss distribution, with a lot more risk capital in the 2.51% to 4.50% band and a reduction of 8% in the lowest banding. The large Everglades Re cat bond slightly skews this as it was issued with an expected loss of 2.53%, but only accounts for some of the rise in that band.
It’s clear that the cat bond market prefers an expected loss from 0.76% to 4.50%, with very few deals or tranches having expected losses much above that. If this was broken down even more we’d likely begin to see a sweet spot emerge around the 1.75% to 2.00% mark where expected losses and risk premiums are generally thought to offer value to both sponsor and investor alike, just the right amount of risk for the right amount of return.
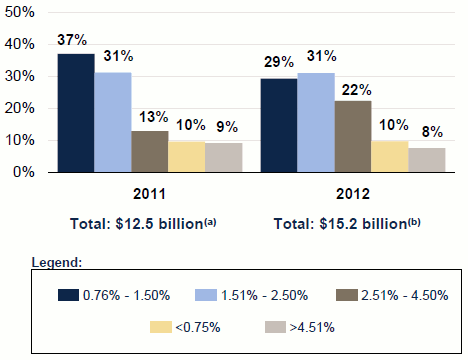
Catastrophe bond risk capital outstanding by expected loss - Source: WCMA Transaction Database as of December 31, 2012
The next graph (below) compares the weighted average quarterly risk premium and expected loss of catastrophe bonds, in this case just U.S. hurricane exposed as WCMA has separated deals out so you can more clearly see the trends. With U.S. wind still dominating the outstanding cat bond market with about 70% or so of the risk capital, it’s essential to do this or the data for diversifying perils is overwhelmed by the higher risk U.S. wind.
So, we last covered the data from this graph, and the one below it, at the end of Q3 (here) when the weighted average expected loss had been static at 2.4% for U.S. wind exposed cat bonds. By the end of Q4 that had risen slightly to 2.5%, so a slight jump in the riskiness of outstanding U.S. wind cat bonds helped by a number of deals with higher expected losses such as Mythen Re Ltd., which had two tranches with higher expected loss hurricane risk, Residential Reinsurance 2012 Ltd. which has some high expected loss tranches of risk as well and Compass Re Ltd. which has an expected loss above 4%.
Interestingly, and perhaps demonstrating the value that can be had in cat bond issuance right now, the weighted average risk premium of U.S. wind exposed cat bonds dropped in Q4 by 0.4% to 11.6%. This is quite a drop when expected losses had risen slightly and if you look at the way expected losses climbed through the second half of 2011 and into 2012 you can clearly see that sponsors can issue much riskier deals with a higher expected loss but risk premiums have not risen as quickly and have now dropped slightly. Whether this is a trend that will continue is impossible to say but we’ll update you at the end of this quarter. It does however suggest that now might be a very good time to issue U.S. hurricane cat bonds. The final thing on this chart is that it clearly shows the risk appetite for U.S. wind growing and investors willing to take on riskier tranches of notes over the last two years.
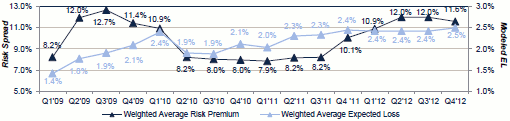
Quarterly Weighted Average Risk Premium and Expected Loss of U.S. Wind Exposed Catastrophe Bonds (Source: WCMA transaction database as of 31st Dec 2012)
Now we look at the quarterly weighted average risk premium and expected loss for non-U.S. wind exposed cat bonds, so this includes European windstorm, Japanese earthquake and typhoon, as well as U.S. earthquake risk cat bonds. Q3 had seen a pretty hefty drop in the average expected loss but that has recovered strongly in Q4 to 1.7%. The weighted average risk premium also increased in Q4 rising from 4.9% to 5.4%.
It’s tough to predict where this chart will go, as a lot of its movement has been driven by maturities and large, low expected loss deals. The cat bond market does not really seem to have been able to really settle on pricing and risk appetite for European windstorm either and it does seem to be a limited portion of the outstanding cat bond market which hasn’t really grown considerably. At the end of Q4 the outstanding non-U.S. hurricane cat bond market was a little riskier, with the higher average expected loss, but with the increase in average risk premium investors were being well compensated for this.
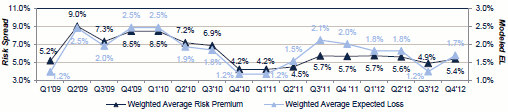
Quarterly Weighted Average Risk Premium and Expected Loss for Non-U.S. Wind Exposed Catastrophe Bonds (Source: WCMA transaction database as of 31st Dec 2012)
So, overall the average expected loss of outstanding catastrophe bonds has risen slightly for U.S. wind exposed cat bonds and fallen slightly for non-U.S. wind exposed, making the market roughly the same on average. However if you look at the first chart in this article again it is clearly shifting towards a slightly higher average, which perhaps denotes a sweet spot where cat bonds can be more efficient.
One thing is clear, looking at the U.S. wind exposed chart in particular, cat bond investors are prepared to take on much higher expected loss for no greater payment than they were receiving three years ago. This clearly shows a maturation among investors and a desire to assume high expected loss tranches of U.S. wind risk.
Read our other article on the WCMA cat bond and ILS market report here.
![]() View all of our Artemis Live video interviews and subscribe to our podcast.
View all of our Artemis Live video interviews and subscribe to our podcast.
All of our Artemis Live insurance-linked securities (ILS), catastrophe bonds and reinsurance video content and video interviews can be accessed online.
Our Artemis Live podcast can be subscribed to using the typical podcast services providers, including Apple, Google, Spotify and more.