At the end of 2011 both of the Swiss Re Cat Bond Performance Indices finished the year with an upward turn. Those who follow our regular articles discussing the indices and how they reflect the sentiment and health of the catastrophe bond market will know that recent weeks have seen the indices fluctuate as they came to terms with Mariah Re losses, priced in the end of the U.S. hurricane season and also the start of the European windstorm season.
The strong fourth quarter of catastrophe bond issuance in 2011, and a record December of new deals, saw many investors re-balancing their portfolios to take advantage of new opportunities to diversify their holdings. This tends to add to fluctuation seen in the cat bond indices as secondary market trading goes through periods of acceleration. Details on every cat bond issued during 2011 can be found in our Deal Directory. With observers predicting that strong issuance will continue into 2012 it’s expected that the indices will stabilise (unless there are any large catastrophe events).
First we turn to the Swiss Re Global Cat Bond Performance Price Return index, which tracks the price return for all outstanding USD denominated cat bonds (which you can quote and chart through Bloomberg here). This index, which had seen a trend of decline through the last months of 2012 has finished the year with a slight upturn. This index closed on the 30th December at 93.82.
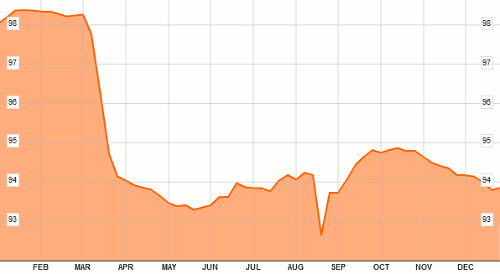
Swiss Re Global Cat Bond Performance Price Return Index
Next we look at the Swiss Re Global Cat Bond Performance Total Return index, tracking the total return of a basket of natural catastrophe bonds (which you can quote and chart through Bloomberg here). Again, this index finished the month of December with an upturn, reflecting the strong issuance in the last weeks of the year. It closed on the 30th December at an all time high of 218.43.
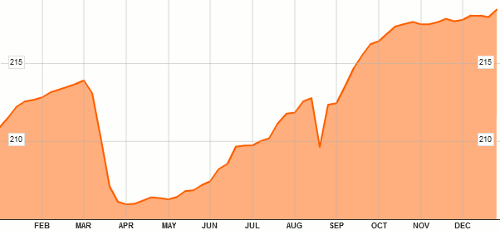
Swiss Re Global Cat Bond Performance Total Return Index
The first quarter of the year historically see’s both of these indices recover some lost ground, reflecting pricing and issuance volumes, which can tend to gain in early months of the year. We’ll continue to update you throughout the year on how the indices develop.
Swiss Re recently shared an interesting graph (below) charting the total return of their Cat Bond Performance Indices between 2002 and 2011. The chart shows where major events impacted the returns on outstanding cat bonds and the recovery that total returns make following these major events.
 View all of our Artemis Live video interviews and subscribe to our podcast.
All of our Artemis Live insurance-linked securities (ILS), catastrophe bonds and reinsurance video content and video interviews can be accessed online.
Our Artemis Live podcast can be subscribed to using the typical podcast services providers, including Apple, Google, Spotify and more.
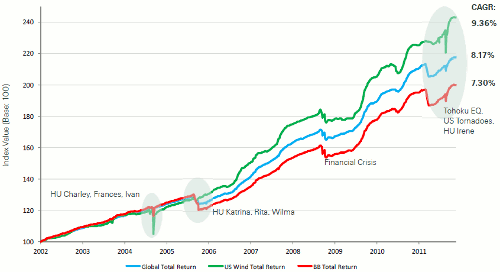
Swiss Re Cat Bond Performance Indices 2002-2011 Total Return


